With a quarter of 2023 in the books, it’s safe to say the lateral gold rush has slowed to a mellow stream.
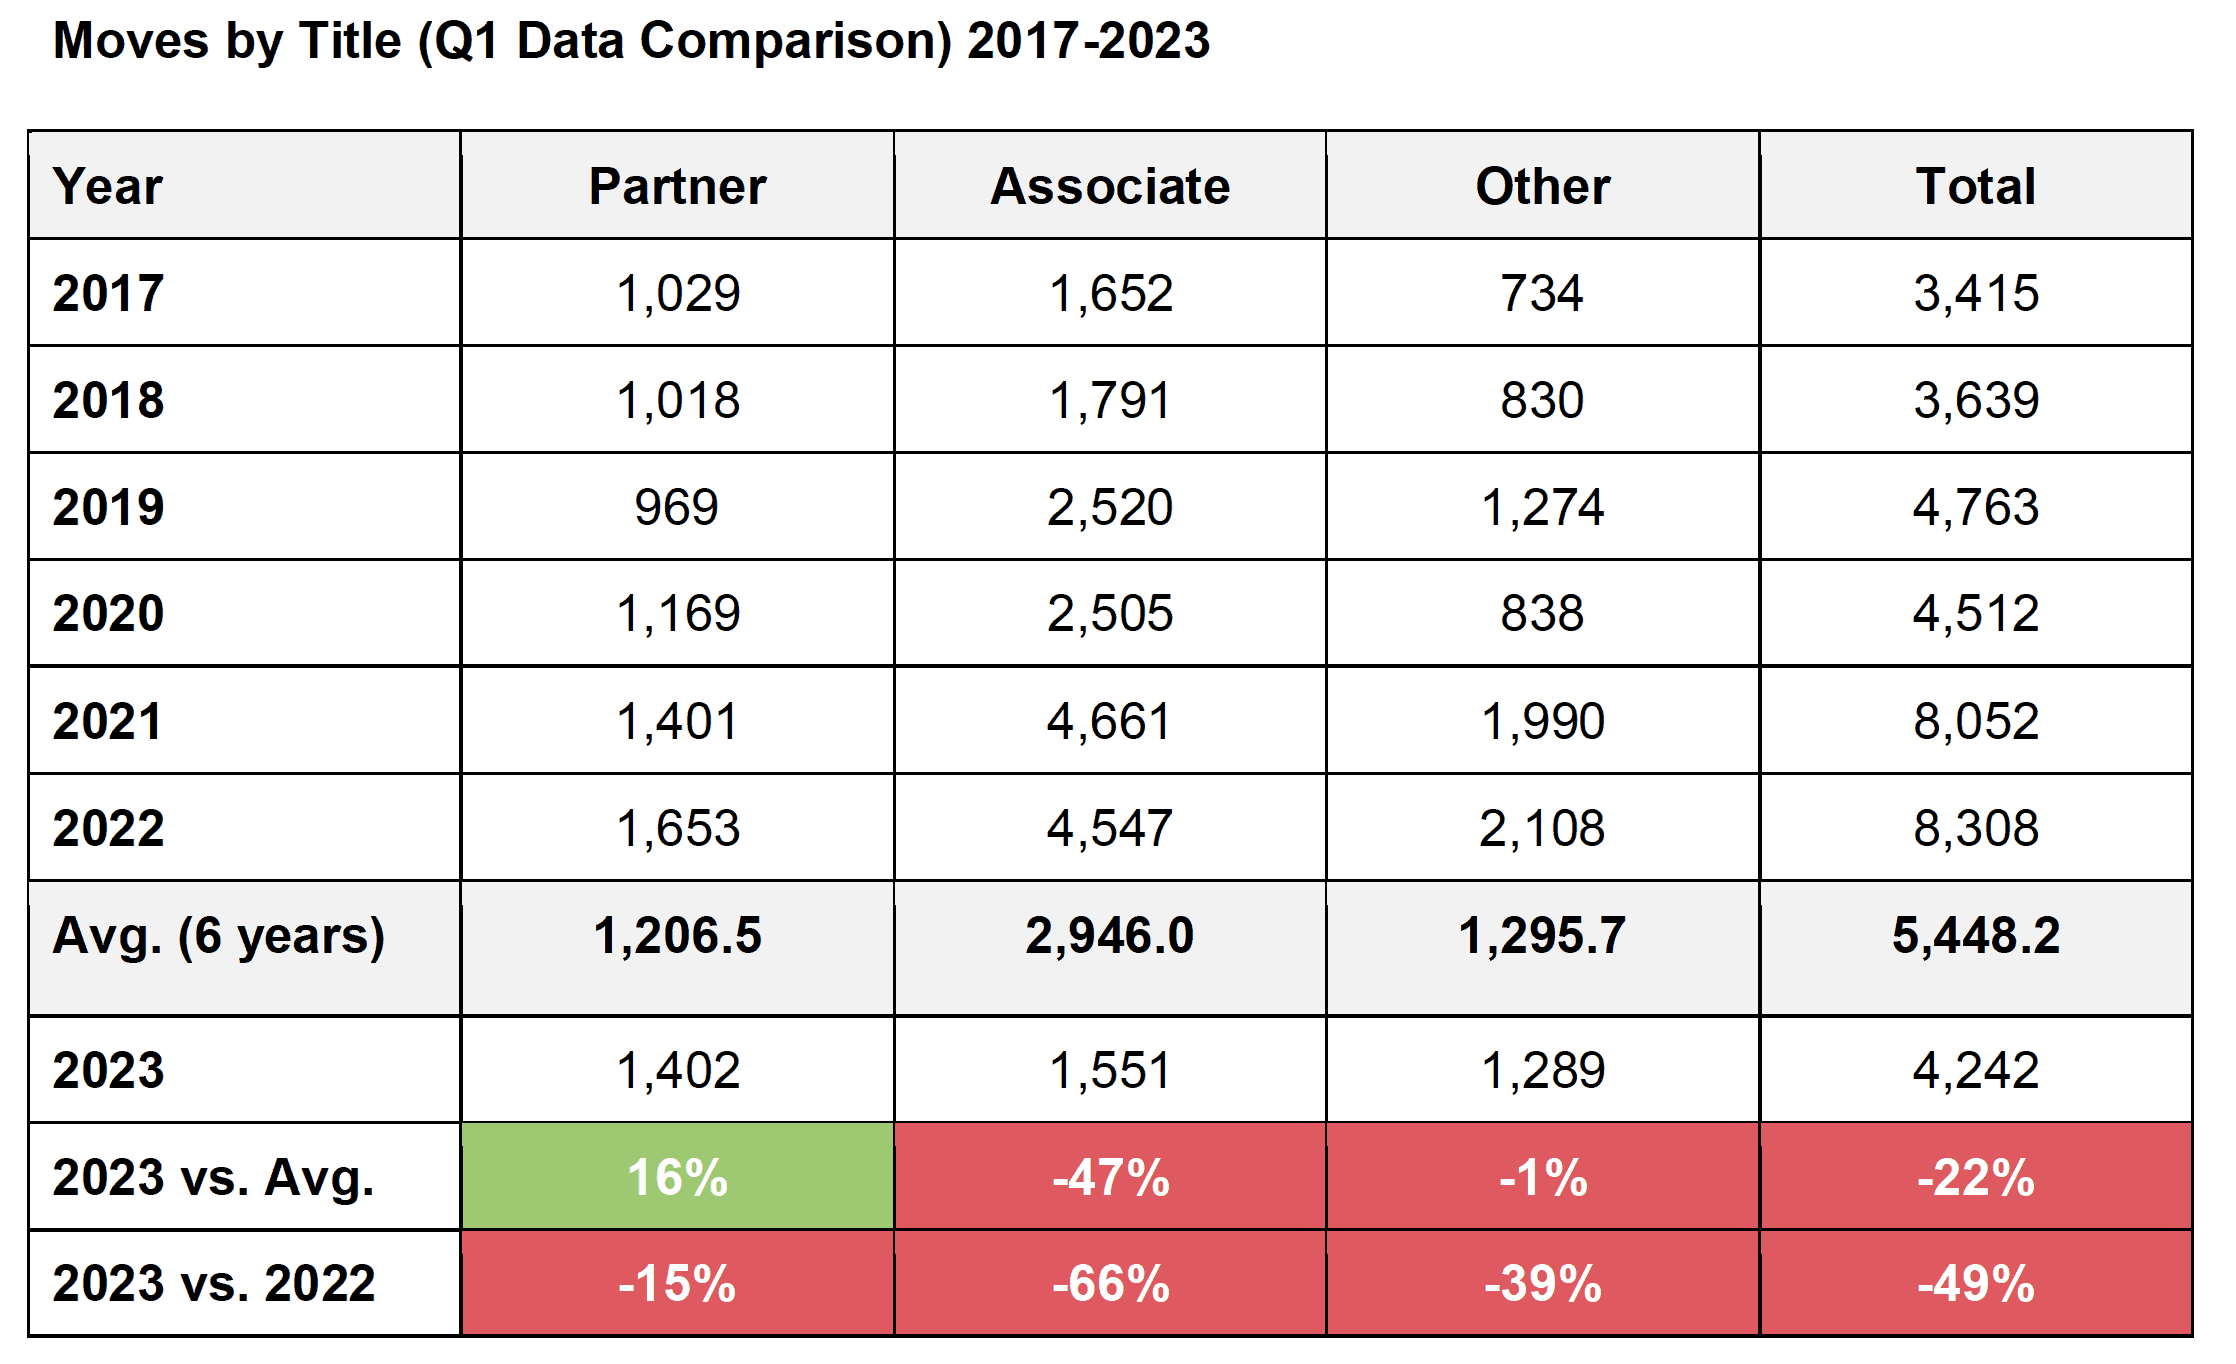
According to data tracked by Decipher Investigative Intelligence, lateral moves across all titles are down by 48% – nearly half – when comparing 2023 Q1 vs. 2022 Q1. Associate moves are down by 66% – a two-thirds decline.
The only bright spot so far in 2023 is partner moves, which have remained consistent compared to the previous six-year average even if they are down year-over-year.
Partner moves for Q1 2023 are tracking very similar to Q1 in 2021, which saw the second-most partner moves in the last six years. So while moves as a whole have cooled off, a steady level of partner mobility appears to be a new normal.
In 2021 and 2022, we saw historic movement that likely inflated the six-year average. So while there’s a lot of red on this board, the sky isn’t falling, especially for partner moves.
In 2022, partner moves increased by 16 percent vs. 2021 and by 46 percent over the previous five-year average. If the Q1 trends hold in 2023, partner moves will be around flat year over year and exceed the previous six-year average by 41%.
Meanwhile, associate moves are on pace to fall by 60% year over year and by 45% compared to the previous six-year average. While this drop might seem dramatic, what’s happening in the profession is closer to a rebalancing of associate staffing rather than a purge.
Given the precarious economic situation, firms aren’t really sure where their staffing levels will need to be at the associate level. We’re seeing a market-wide holding pattern: Firms have let go of associates in practices that are slowing down (more on that below) but haven’t considered scaling up yet in practice areas that are growing.
Location data
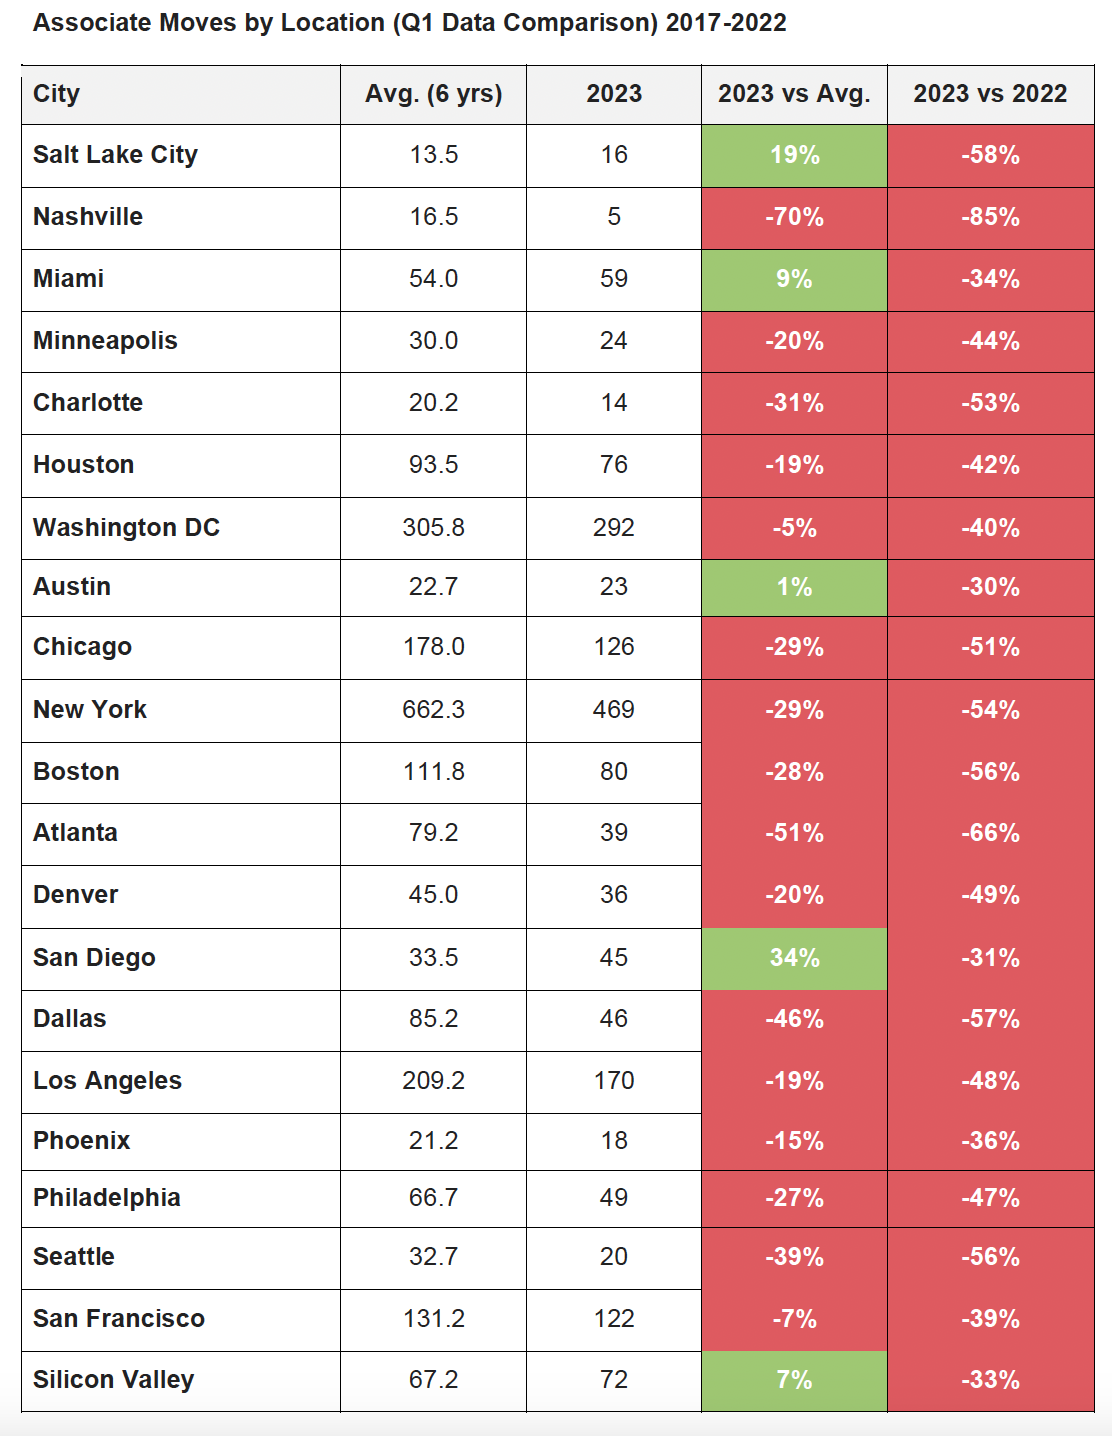
The data on associates doesn’t improve when looking at moves by location in Q1. Associate moves saw double-digit decreases in every location compared to Q1 last year.
However, there are a few bright spots when compared to the previous six-year average, mostly in growth markets:
- San Diego, up 34%
- Salt Lake City, up 19%
- Miami, up 9%
- Silicon Valley, up 7%
- Austin, up 1%
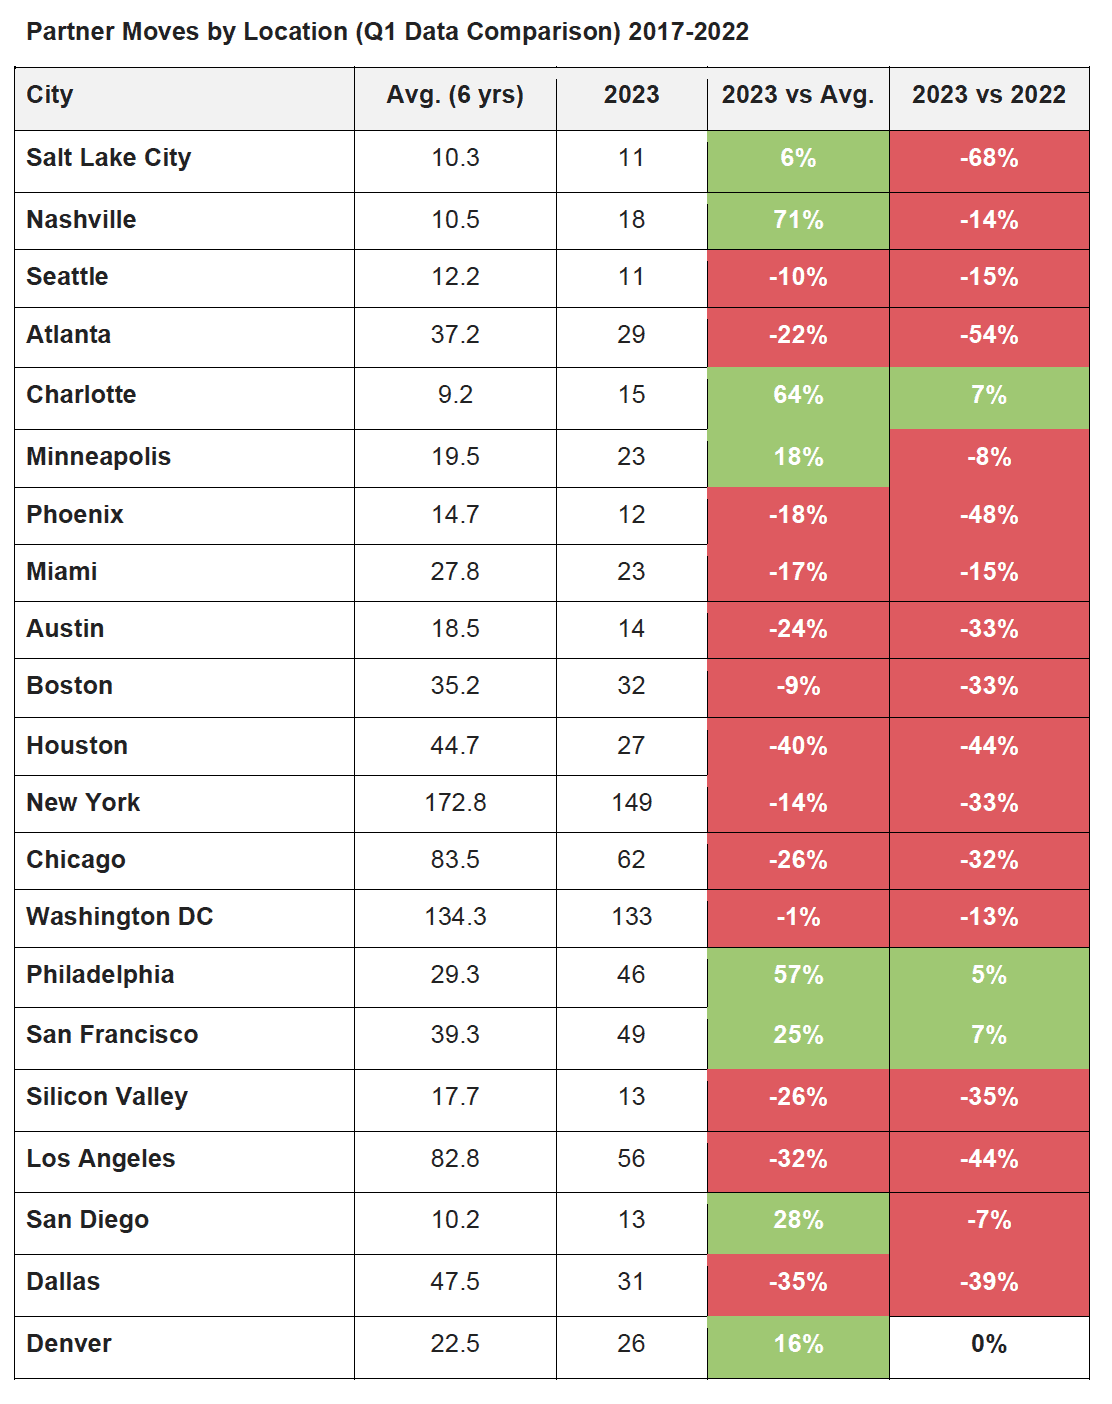
Partner moves were also significantly down, but not as much as associates.
Three markets saw a year-over-year increase and increase over the previous six-year average:
- Charlotte, up 64% over six-year average, up 7% year-over-year
- Philadelphia, up 57% and 5%
- San Francisco, up 25% and 7%
Four other markets also have double-digit growth compared to the previous six-year average:
- Nashville, up 71%
- San Diego, up 28%
- Minneapolis, up 18%
- Denver, up 16%
One reason for the increase in these markets is many experienced a slow growth in partner moves during 2017-2019.
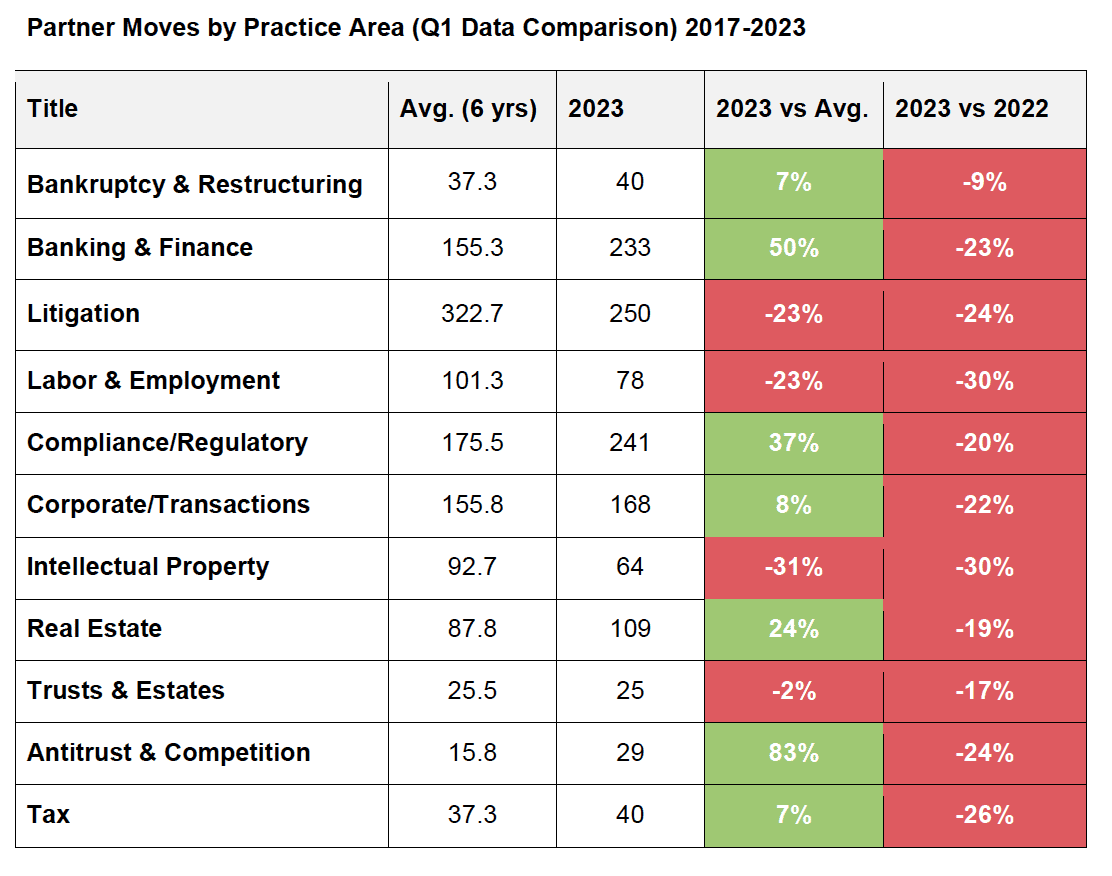
Practice area data
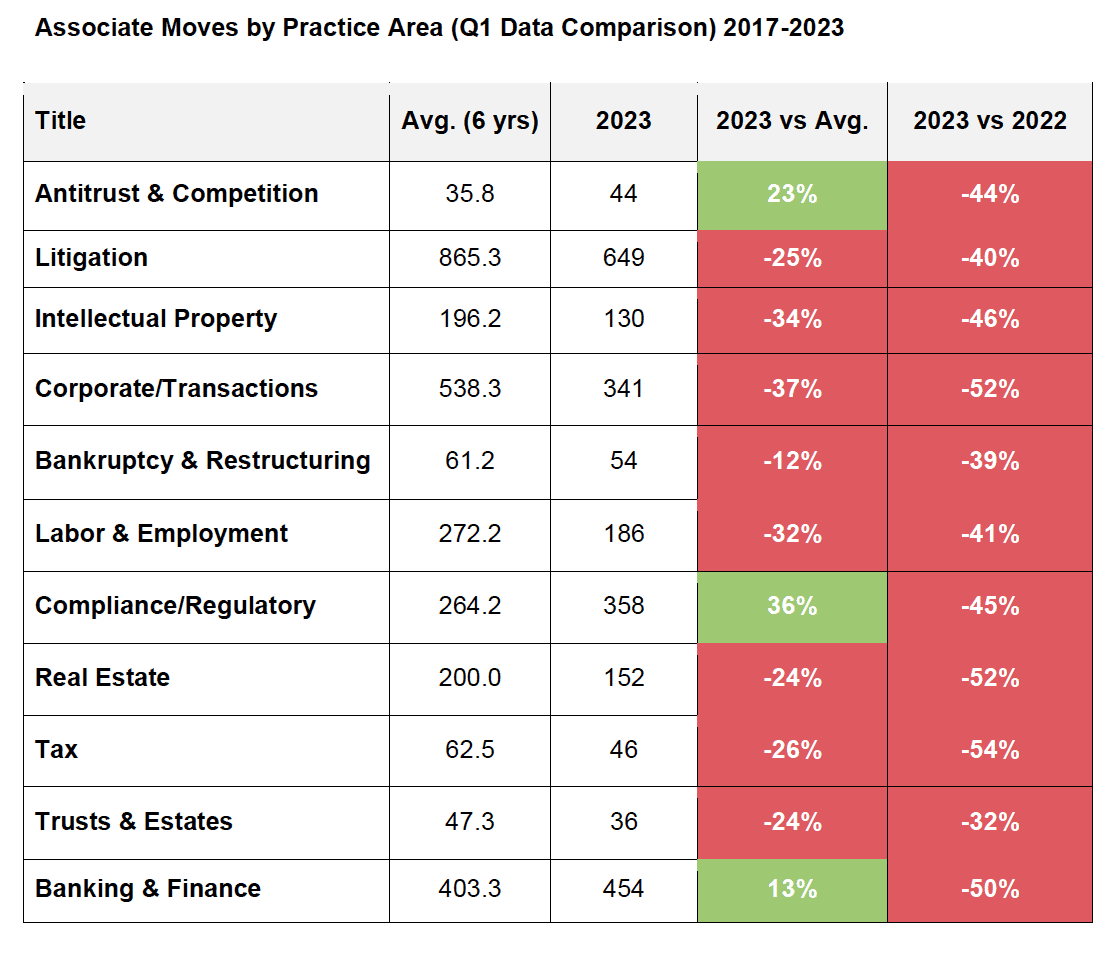
For both partners and associates, there was a double-digit decrease in the number of lateral moves for every practice area in Q1 2023 vs. Q1 2022.
There were some positive numbers for partners when compared to the previous six-year average.
- Antitrust, up 83%
- Banking/Finance, up 50%
- Real Estate, up 24%
- Compliance/Regulatory, up 37%
For associates, all practice areas saw a decrease in movement compared to the previous year, but three areas saw an increase when compared to the previous six-year average.
- Compliance/Regulatory, up 36%
- Antitrust, up 23%
- Banking & Finance, up 13%
As we noted earlier, firms are in a holding pattern as they reevaluate staffing levels, but could be looking to add associates to growing practice areas.